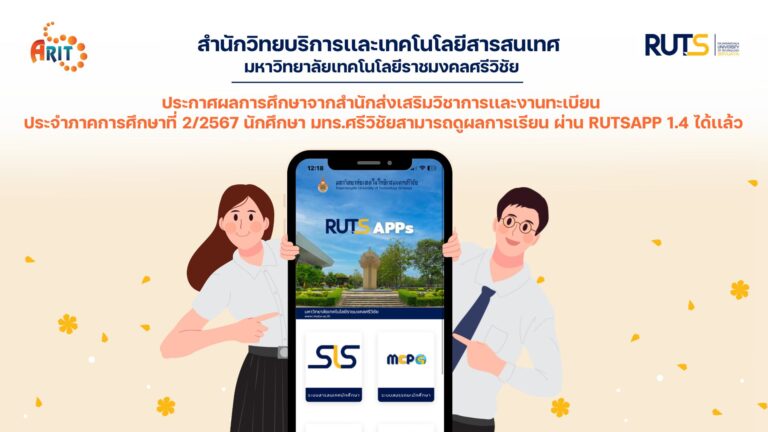
พบกับ RUTS APP
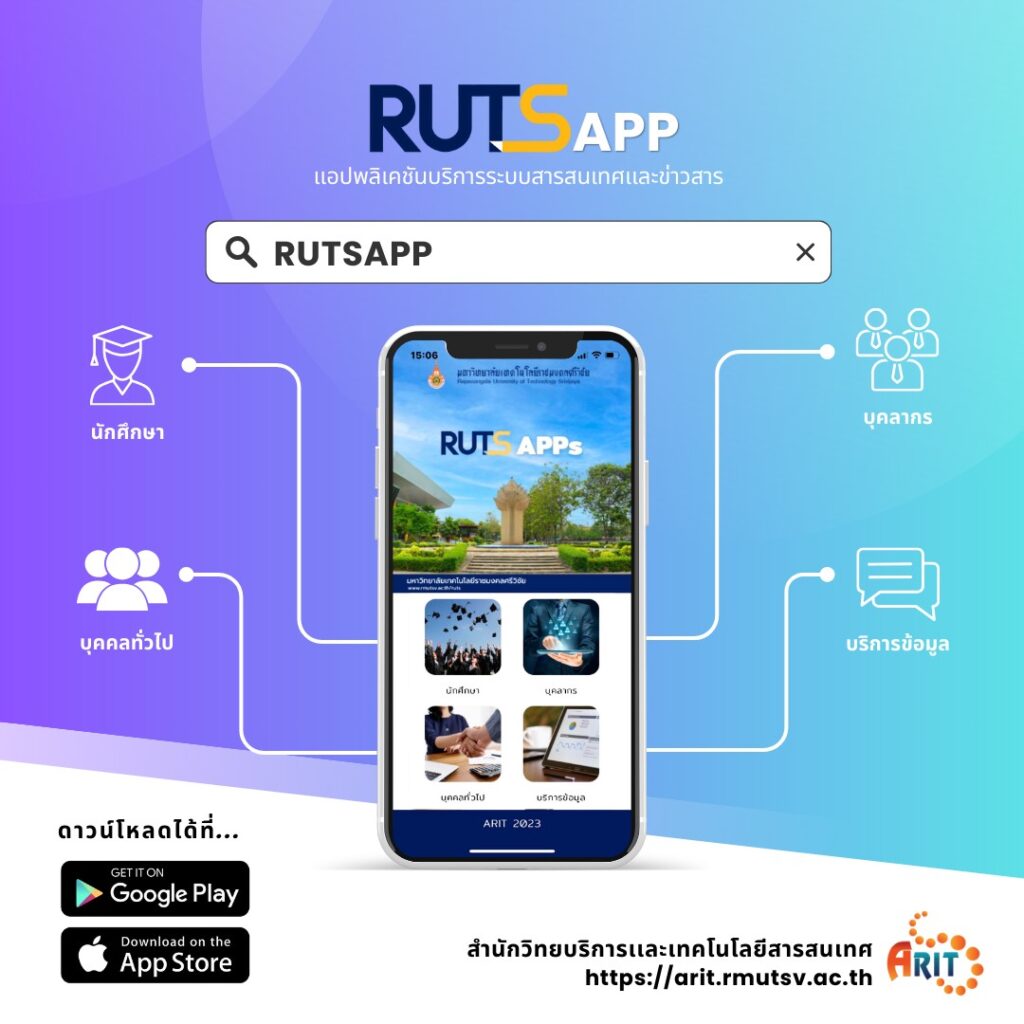
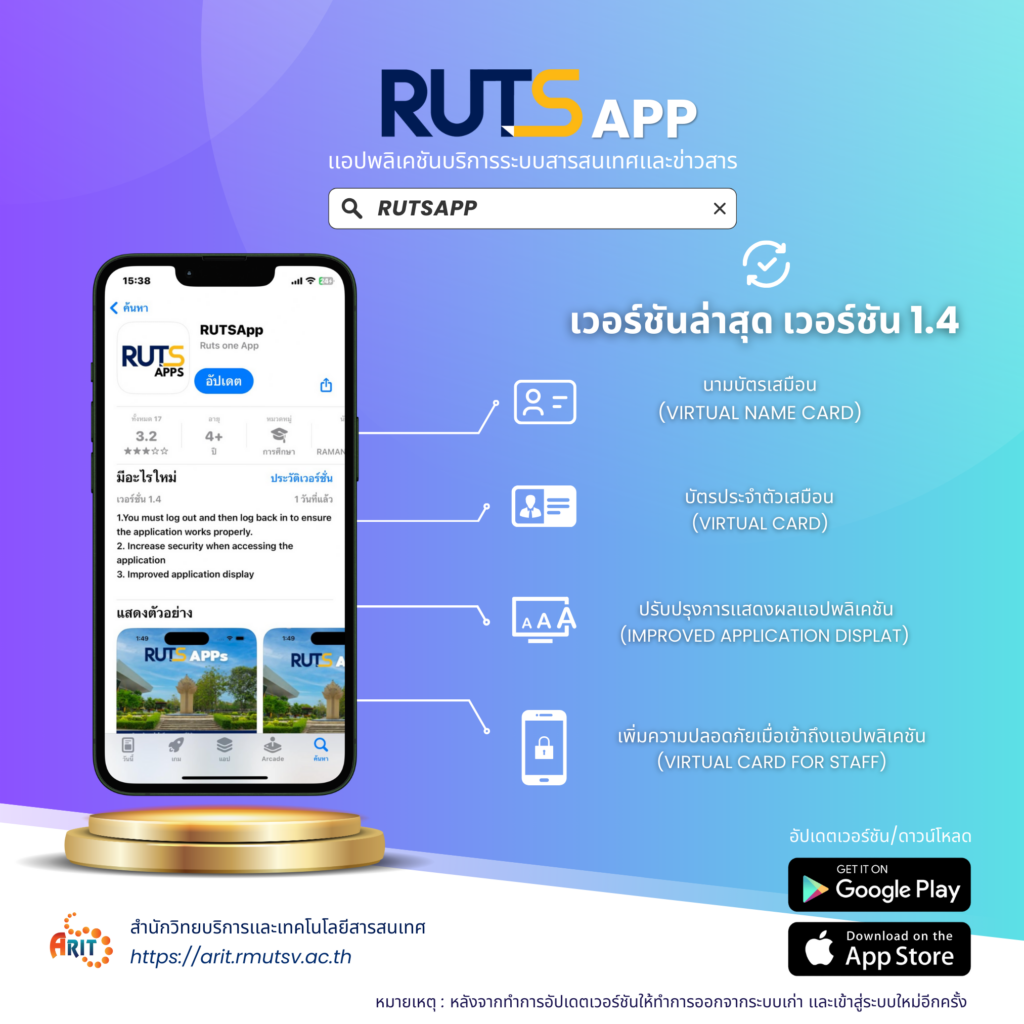
เป็นแอปพลิเคชันที่รวบรวม ระบบต่าง ๆ ที่พัฒนาโดยสำนักวิทยบริการและเทคโนโลยีสารสนเทศ ให้มาอยู่ในระบบปฏิบัติการ iOS และ Android เพื่อสามารถทำงานได้ทุกที่ทุกเวลา ทุกอุปกรณ์
ระบบสารสนเทศที่พัฒนาโดยสำนักวิทยบริการและเทคโนโลยีสารสนเทศ สวส.
ระบบรายงานตัวชี้วัด (KPI-MOR)
เป็นระบบใช้สำรหรับบันทึกข้อมูลตัวชี้วัดและเงื่อนไขต่าง ๆ พร้อมทั้งผู้รับผิดชอบตัวชี้วัดต่าง ๆ ป้อนข้อมูลในการดำเนินการ และผู้รับผิดชอบสามารถรายงานเป้าประสงค์ได้
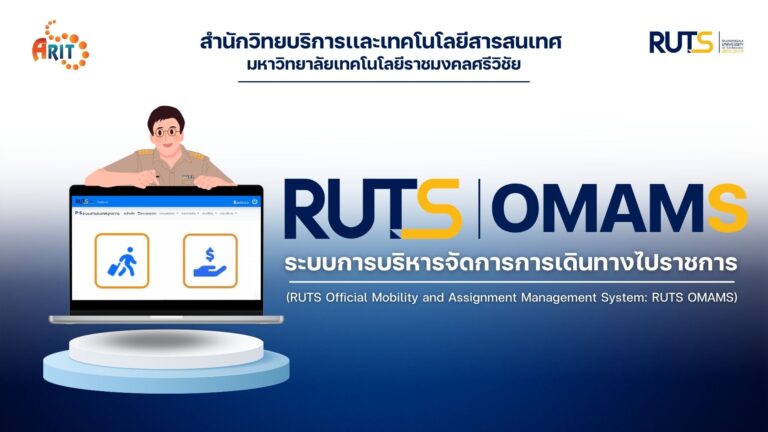
Application เซ็นเอกสารอิเล็กทรอนิกส์
เป็น Application ที่ใชัสำหรับการลงนาม และเกษียนหนังสือ สำหรับผู้บริหาร ทำให้มีความสะดวก ความรวดเร็ว มากยิ่งขึ้น.
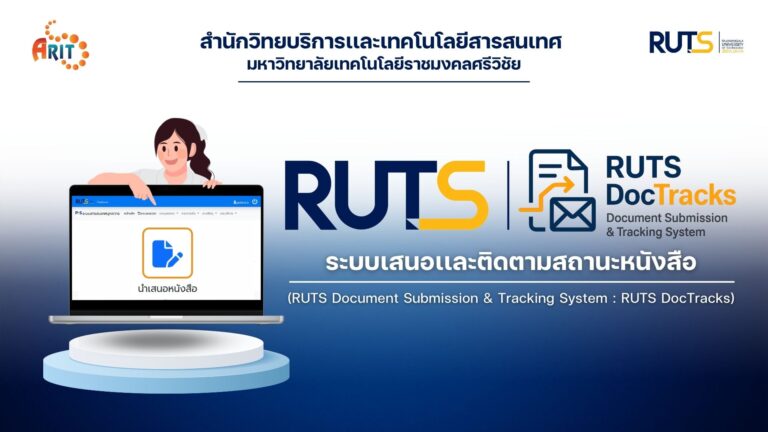
ระบบจัดเก็บเอกสารอิเล็กทรอนิกส์
เป็นระบบที่ใช้ในการรับส่งหนังสือเอกสารทางราชการทั้งภายในและภายนอก เพื่ออำนวยความสะดวกในการสืบค้นหนังสือ ทำให้สามารถประหยัดเวลา งบประมาณ และลดความผิดพลาด ต่างๆ ของงานเอกสารได้
ระบบภาวะการมีงานทำของบัณฑิต
เป็นระบบที่ใช้ประเมินบัณฑิต/มหาบัณฑิต เกี่ยวกับสถานะการมีงานทำ ความรู้ความสามารถพิเศษที่ช่วยให้บัณฑิตได้ทำงาน มีเงินเดือนหรือรายได้ต่อเดือน ความพึงพอใจต่องานที่ทำ ระยะเวลาที่ได้งานทำหลังจากสำเร็จการศึกษา ลักษณะงานที่ทำตรงกับสาขาที่สำเร็จการศึกษาและประยุกต์ใช้กับหน้าที่การทำงานอย่างไร
ข่าวประชาสัมพันธ์
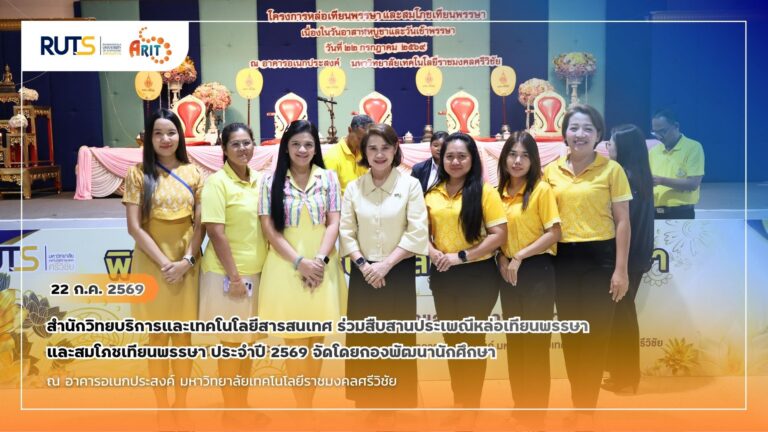
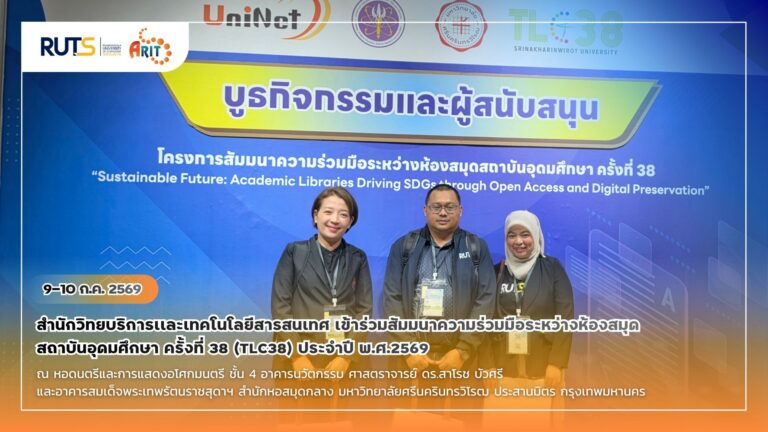
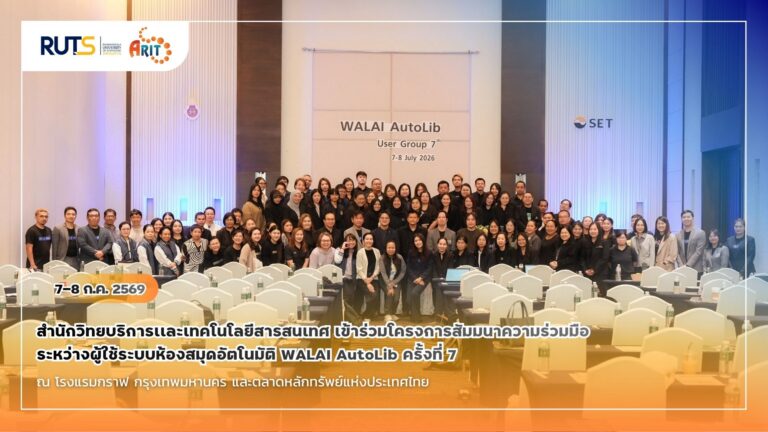
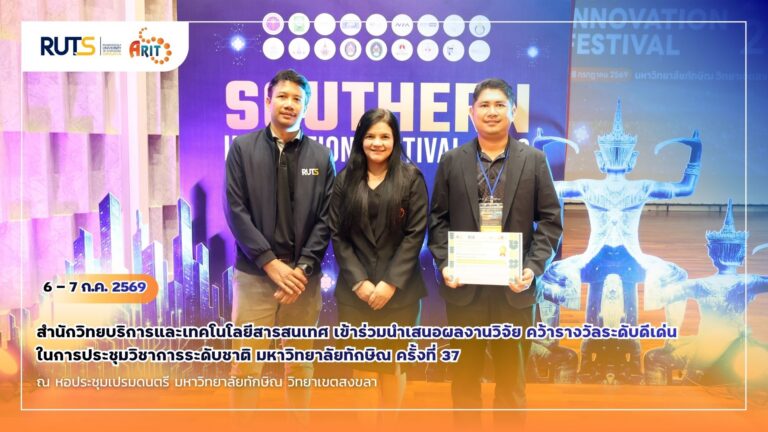
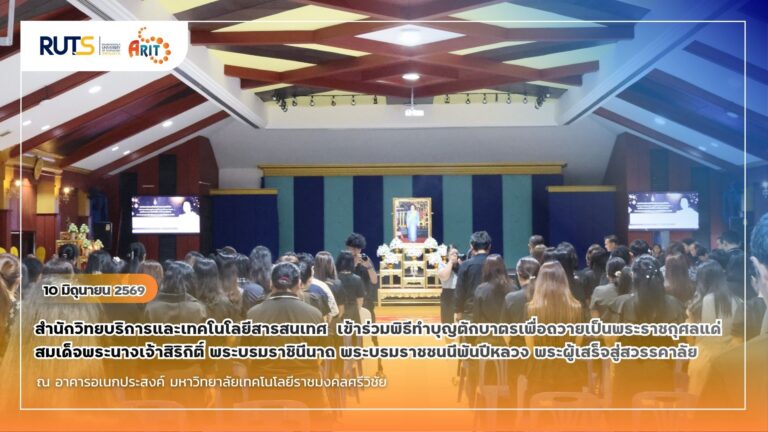
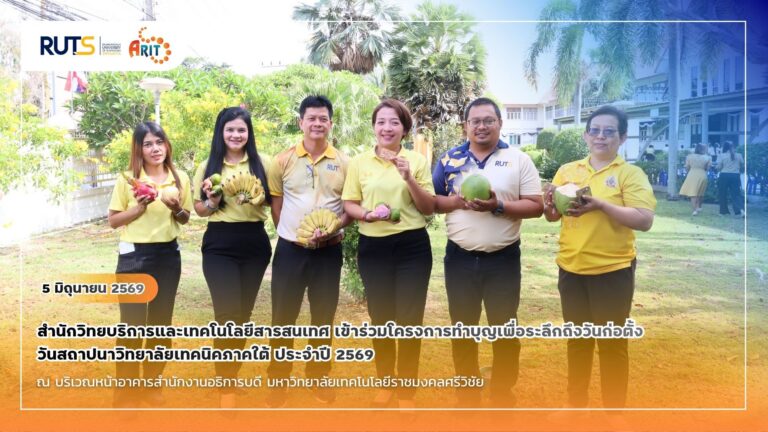
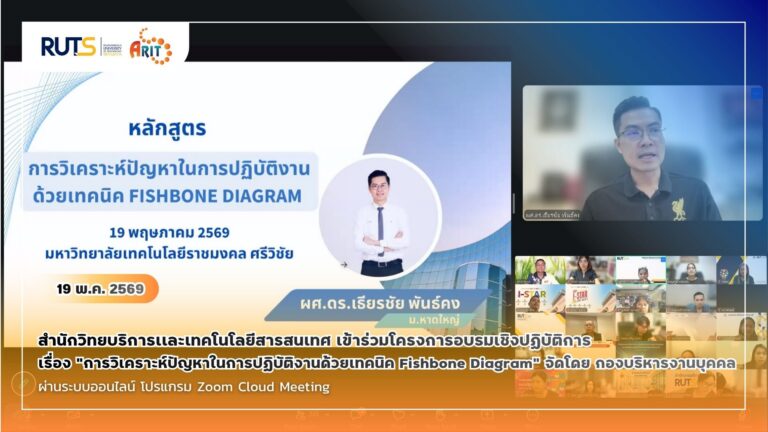
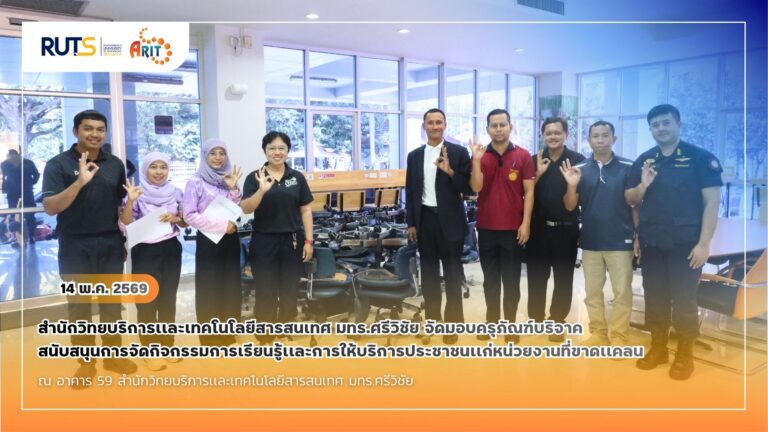
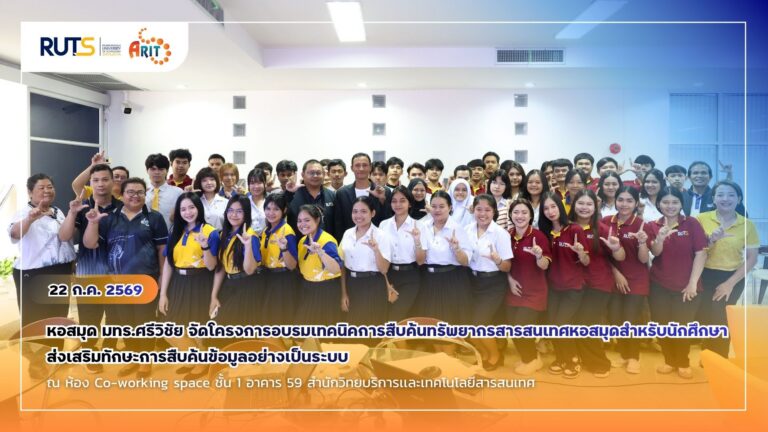
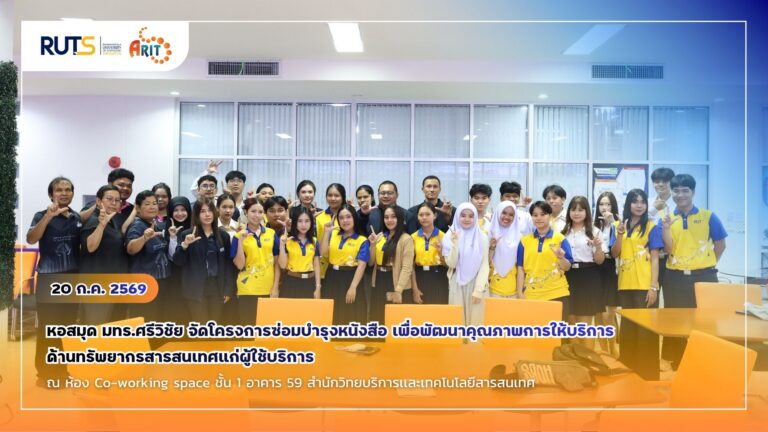
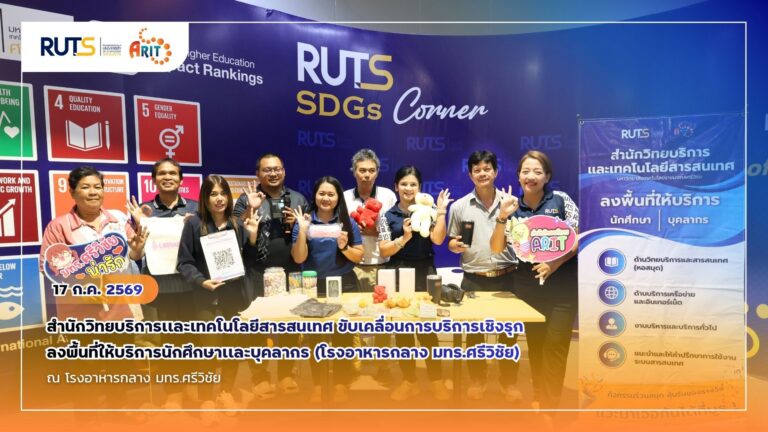
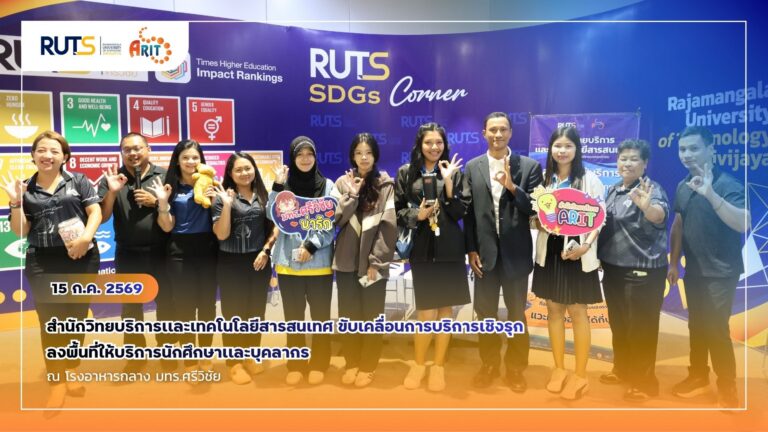
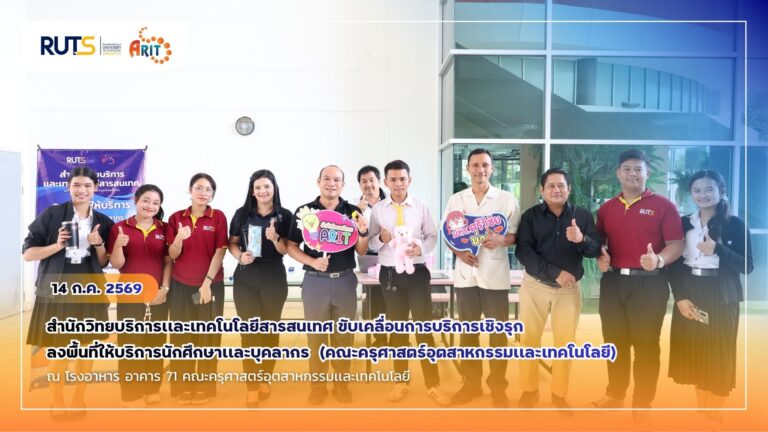
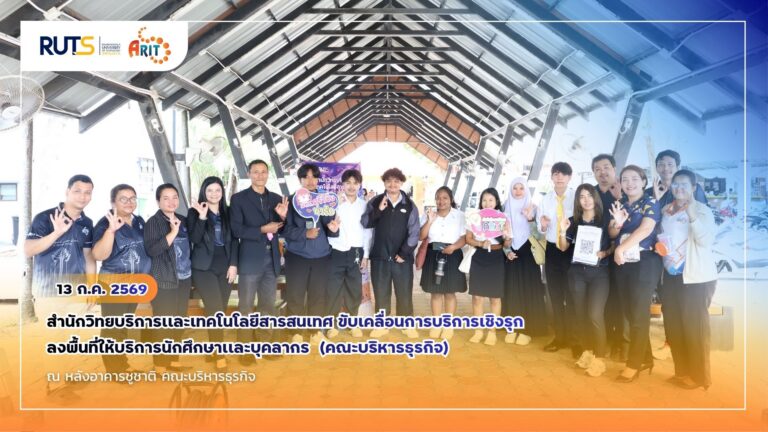
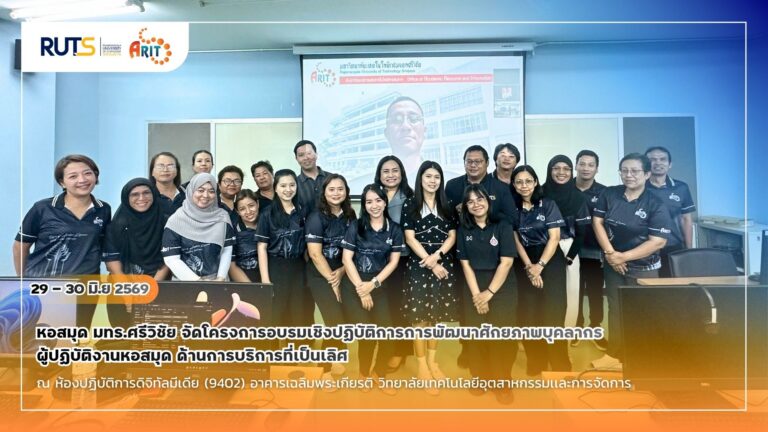
ข่าวกิจกรรม

ข่าวระบบสารสนเทศเพื่อการบริหารและการบริการ


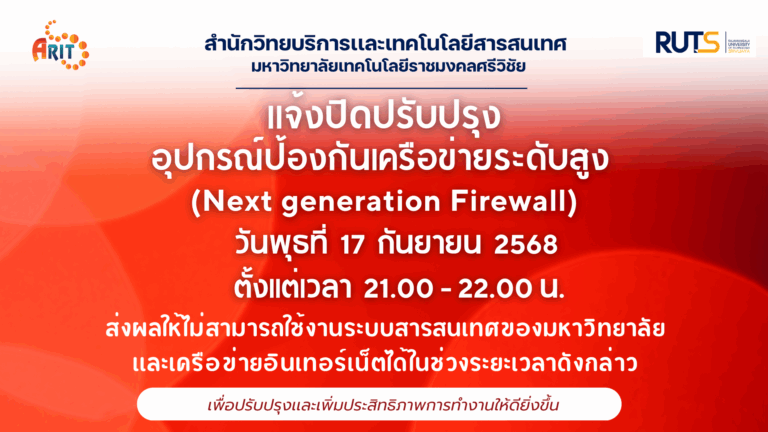
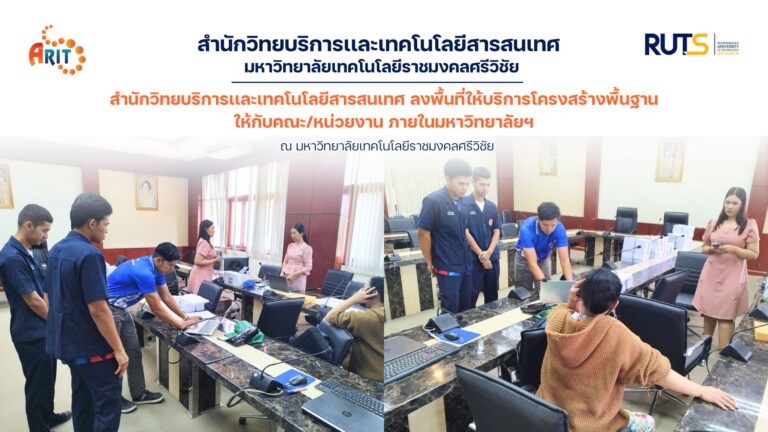
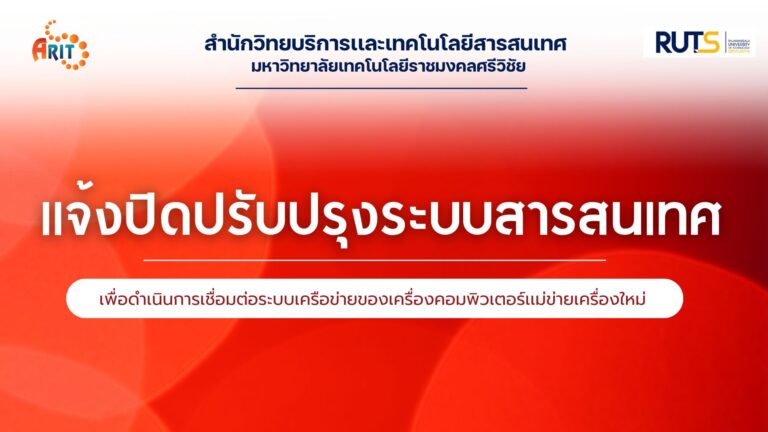
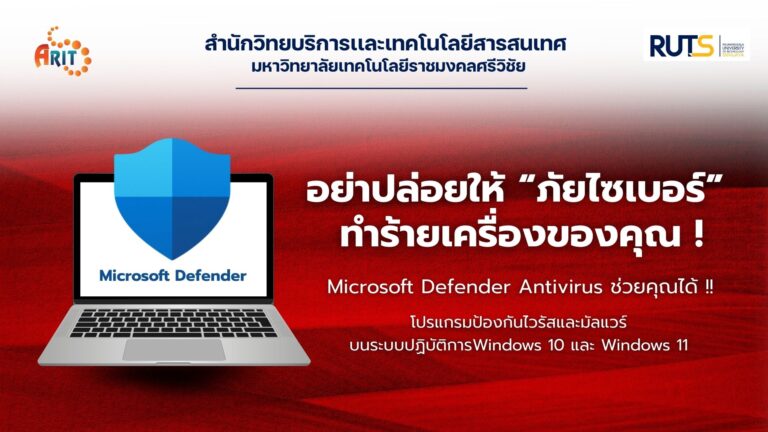
ข่าวการบริการโครงสร้างพื้นฐาน


สำนักวิทยบริการและเทคโนโลยีสารสนเทศ สวส. มทร.ศรีวิชัย